3D website performance
Measured load times for eight real-time 3D sites, where the time goes, and the fixes that cut it without changing a pixel.
Most slow 3D websites are slow for the same few reasons, and you can find them in an afternoon with the right measurements. This guide shows what we measure, what our own eight 3D concept sites weigh and how long they take on a phone, where that time goes, and the fixes that made several of them twice as fast without changing what they look like. All eight were made by the Laarpi team with the library behind Laarpi's 3D website builder. Every number here is measured and dated, and where we did arithmetic instead, we say so.
The short answer
A 3D page has four costs before the visitor sees the scene:
- Discovery. The browser can't fetch a model until the script that asks for it has loaded, and that script often waits for a library, which waits for another module.
- Bytes. Models, textures and lighting files on a slow link.
- Main-thread work. Compiling shaders, decoding images, uploading textures to the graphics card, and your own setup code.
- Render-blocking extras. Third-party font stylesheets that hold back the first paint.
Fix them in that order. Discovery is free to fix and usually the biggest win. Bytes come next. Main-thread work decides how the page feels once it arrives.
Measure first
The profiles
We load every site cold: a fresh browser profile, no cache, and real round trips for every new connection.
| Profile | Network | CPU | Screen |
|---|---|---|---|
| Fast | 50 Mbps down, 20 ms round trip | Full speed | 1440 × 900 |
| Typical | 10 Mbps down, 60 ms round trip | Full speed | 1440 × 900 |
| Phone | 1.6 Mbps down, 150 ms round trip (slow 4G) | Slowed four times | 390 × 844, touch |
We shape the network with a small proxy rather than DevTools throttling. DevTools adds delay per request but charges nothing for opening a connection, and that hides exactly what a page loading from five or six origins pays for.
The metrics
- First paint: when anything appears.
- First composed frame: the first frame that shows the finished hero, with the 3D drawn, fonts loaded and the canvas visible. This is what a visitor would call "loaded".
- Largest Contentful Paint (LCP) and Interaction to Next Paint (INP): the Core Web Vitals, covered further down.
- Longest main-thread task: a frozen page, even when it looks ready.
One caution: the phone profile slows the CPU but not the graphics chip, so real phones can take longer on shader-heavy scenes than any lab number shows.
Our numbers
All eight sites, cold, on the phone profile, measured on 6 October 2026 just before and just after a loading pass on each. "Sent" is bytes on the wire for the whole cold load, except where marked.
| Site | First full frame: before | After | Sent: before → after | Origins | What the first frame needs |
|---|---|---|---|---|---|
| BASALT | 5.7 s | 3.1 s | 646 → 299 KB | now 1 | Code only: no images, models or HDRI |
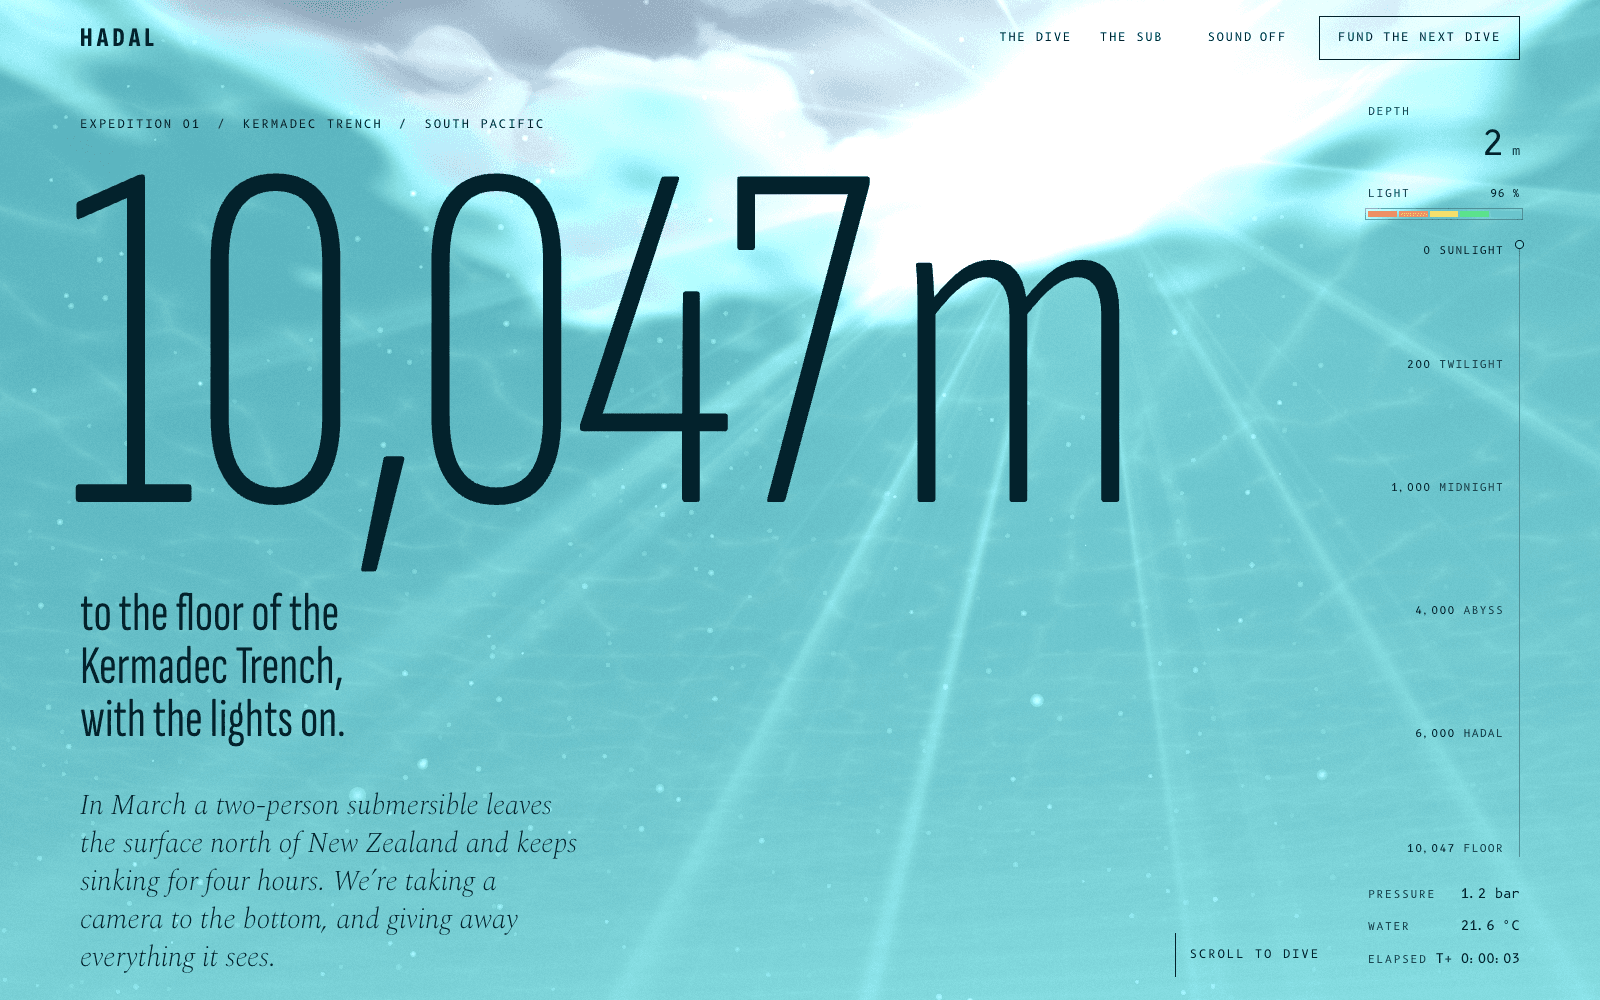
| HADAL | 7.2 s | 3.8 s | 756 → 369 KB (to the first frame) | 4 → 1 | Code and one sky photo; the seabed waits |
| FLUOR 26 | 6.5 s | 4.6 s | 1,257 → 911 KB | 4 → 1 | A code-driven ink simulation; the photos wait |
| PATCH-01 | 15.7 s | 7.8 s | 1,990 → 933 KB | 4 → 1 | A code-built module, a 512 px HDRI |
| Meridian M-01 | 14.5 s | 11.5 s | 1,989 → 1,712 KB | 4 → 1 | A code-built movement, 31 shader programs, a 1k HDRI |
| Aster & Kiln | 15.1 s | 11.8 s | 2,255 → 1,904 KB | 6 → 1 | A 1k HDRI and three clay maps |
| Hortus Nocturne | 16.4 s | 13.1 s | 2,347 → 1,979 KB | 4 → 1 | A 1.1 MB photoscan, about 400 KB of textures |
| Salt & Smoke | 21.3 s, half-textured | 31.1 s, complete | not compared | 4 → 1 | Four scans, five materials, a moon map, 3D smoke |
Each site's write-up has its own speed section and the story behind its loader: BASALT, HADAL, FLUOR 26, PATCH-01, Meridian M-01, Aster & Kiln, Hortus Nocturne and Salt & Smoke. Each pass was checked against captures of the site's whole scroll journey, before and after, at desktop and phone sizes and with reduced motion. Apart from the new loaders, the sites look the same.
Salt & Smoke got slower on paper, on purpose. Before, its fallback timer revealed a coast with textures still missing at 21.3 s, and they kept arriving until about 37 s. Now it waits for the complete frame behind a loader that shows real progress. We chose an honest wait over a half-drawn reveal. It is still too heavy for a phone on slow 4G, and the table says so.
On the fast profile the picture is different. In the 4 October audit, the median first composed frame was 1.0 s for BASALT and 2.2 s for HADAL and Aster & Kiln. So most of what you see above is the slow link and the slowed CPU, not the scenes themselves.
Where the time went
The 4 October audit traced every request and every main-thread task on all eight sites. Ranked across the eight:
- Serial discovery. Each site found its 3D one hop at a time: HTML, then the main script, then the 3D library in two modules, and only then the hero's assets. On the phone profile the HTML was in by about 0.8 s, but hero assets weren't even requested until 6.5 to 8.0 s.
- Shader compilation, on the main thread. Meridian compiled 43 programs, Salt & Smoke 38 and PATCH-01 26. On the phone profile that took 4.2 to 4.9 s for PATCH-01 and Meridian, during which the page couldn't respond.
- One loop in site code. Hortus Nocturne computed its garden route with about 6,800
getPointAtLengthcalls at start-up: 1.4 to 2.8 s of frozen main thread. The values never change, so they can be computed once at build time. - First-frame bytes. Three 1k HDRIs of 1.5 to 1.6 MB each. By arithmetic from the link rate, each megabyte costs about 0.17 s on fast, 0.84 s on typical and 5.2 s on the phone profile.
- Render-blocking font stylesheets. Every site waited for Google Fonts or Fontshare CSS before its first paint: 1.7 to 2.3 s on the phone profile.
- No compression on the host. Text files could have been 66 to 78 % smaller with brotli.
Fixes that kept every pixel
We only ship a change to an asset if renders of the same states, before and after, match within a tight tolerance at desktop and phone sizes, and a person flipping between them can't see a difference. Ordering, preloading, compression on the wire and compiling earlier don't change pixels at all, so they come first.
1. Serve everything from one origin
Bundle the 3D library down to the parts you use, self-host the fonts, and serve both from the site's own origin. Each new origin costs DNS, TCP and TLS round trips, and on a 150 ms link that adds up fast. HADAL went from four origins to one in its loading pass, and together with the deferral below, its first full frame on the phone profile went from 7.2 s to 3.8 s. Aster & Kiln had six origins before its pass.
2. Tell the browser about the first frame up front
List what the first frame needs in the HTML, so the browser fetches it in parallel instead of discovering it hop by hop:
<link rel="modulepreload" href="scripts/vendor/three.js">
<link rel="modulepreload" href="scripts/main.js">
<link rel="preload" href="assets/rock.glb" as="fetch" crossorigin>
The crossorigin attribute matters on the fetch preload: without it, the browser won't reuse the preloaded response for your loader's fetch() call and downloads the file twice.
3. Defer everything below the fold
HADAL's seabed, about 1.8 MB of scanned textures and a boulder, loads only as you approach the floor at 10,047 m. FLUOR's three hall photographs, about 580 KB together, wait until the first frame is on screen. Neither change touches the first frame, and both took hundreds of kilobytes off the critical path.
4. Compress geometry; don't re-encode lossy textures
Geometry compresses well. HADAL's boulder went from 1.47 MB to 185 KB with meshopt and resized WebP textures (the command is in how to build a 3D website).
Textures are a trap. We tried re-encoding the shipped WebP textures as AVIF and WebP at higher quality. At a quality where no difference was visible, normal maps came out 43 to 64 % larger, and colour maps from 1 % smaller to 113 % larger. They were already lossy, and re-encoding only stacked loss on loss. Real savings need the original sources, KTX2, or textures sized to how large they appear.
5. Resize lighting files only when renders agree
PATCH-01's HDRI went from 1.49 MB at 1k to 512 KB at 512 px, because its light is graded into a black room and the renders didn't change. The same resize failed on Aster & Kiln's wet clay and Meridian's mirror-polished parts, where reflections showed the loss. They keep the 1k file.
6. Compile shaders off the main thread, and make fewer of them
renderer.compileAsync(scene, camera) uses the browser's parallel shader compilation where available, so the page stays responsive and a loader keeps animating. HADAL's scene warms up with exactly this line:
const warm = () => (renderer.compileAsync ? renderer.compileAsync(scene, camera) : Promise.resolve());
Fewer material variants help even more. Meridian went from 43 programs to 31 in its loading pass. Salt & Smoke's wait for shaders dropped from about 430 ms to about 130 ms.
7. Decode images off the main thread
TextureLoader decodes on the main thread during upload; on the phone profile a single 1024 px WebP cost up to 196 ms. Fetching the bytes and decoding with createImageBitmap moves that work off the main thread. Hortus Nocturne and Salt & Smoke both do this now.
8. Once it runs: cap, adapt, pause, release
- Cap resolution. Our sites render at no more than 2× on desktop and 1.5× on touch screens, lower for the heaviest scenes. A phone screen at 3× is 2.25 times the pixels of 2×, for detail nobody sees.
- Step down when frames run long. HADAL measures its frame time and lowers resolution if frames average over 24 ms, and never steps back up, so the picture never oscillates:
if (qN >= 90) {
  const avg = qT / qN;
  qT = 0;
  qN = 0;
  if (avg > 0.024 && pixelRatio > 0.75) {
    pixelRatio = Math.max(0.75, pixelRatio - 0.2);
    renderer.setPixelRatio(pixelRatio);
    snowScale = Math.max(0.5, snowScale - 0.15);
    resize();
  }
}
- Stop drawing when nobody is looking, and free the graphics card when the visitor leaves. From Hortus Nocturne:
document.addEventListener("visibilitychange", () => {
  if (document.hidden) stage.stop(); else if (visible) stage.start();
});
// leaving: free the GPU, unless the page is only going into the back/forward cache
addEventListener("pagehide", (e) => { if (e.persisted) stage.stop(); else stage.dispose(); });
Loaders that tell the truth
A loader can't make a page faster, but a dishonest one makes it feel slower. Ours follow four rules:
- Progress is real. It is completed weight over a list of what the first frame needs: bytes received for each file, plus fonts, shader compilation and the first rendered frame weighted by their measured share of the load. The drawn value may ease toward the real one but never runs ahead of it, and never stalls at 99 %.
- It skips itself when the page is fast. The backdrop is the hero's own background colour; the loader's marks only appear after about 300 ms. On a fast repeat visit, nobody sees them.
- Text is never gated. The real copy is in the document underneath from the first byte.
- It belongs to the idea. FLUOR's loader fills the outline of its wordmark with chartreuse ink as the real progress arrives. Hortus Nocturne's sends in one firefly for each fortieth of the progress, and they land where the scene draws the sheet.
Counting bytes as they arrive takes a few lines. This runs as written, and hands the buffer straight to the glTF parser:
async function fetchWithProgress(url, onBytes) {
  const res = await fetch(url);
  if (!res.ok) throw new Error(`${url}: ${res.status}`);
  const reader = res.body.getReader();
  const chunks = [];
  for (;;) {
    const { done, value } = await reader.read();
    if (done) break;
    chunks.push(value);
    onBytes(value.byteLength);
  }
  return new Blob(chunks).arrayBuffer();
}

let received = 0;
const buffer = await fetchWithProgress("assets/rock.glb", (n) => (received += n));
const gltf = await new GLTFLoader().setMeshoptDecoder(MeshoptDecoder).parseAsync(buffer, "assets/");
Use the file's decoded size from your build as the total. With compression on, Content-Length is the compressed size.
Core Web Vitals for 3D pages
The thresholds haven't changed: LCP within 2.5 s, INP within 200 ms and CLS under 0.1, at the 75th percentile of real page loads. INP replaced First Input Delay in March 2024. Three rules matter for 3D:
- A full-viewport canvas can't be your LCP element. Chrome treats elements that cover the whole viewport as likely background and leaves them out. Your headline or hero image will be the LCP element, so render it as HTML immediately, not after the 3D.
- Iframes count in the field. Lab tools ignore iframe content, but Chrome's field data can attribute an embedded site's largest element to the parent page. Embedding a heavy WebGL demo can fail LCP for real visitors while lab tests pass.
- Shader compilation is an INP problem. A 2-second compile is a 2-second window in which a tap does nothing. Compile asynchronously and split long set-up tasks.
Reserve the canvas's space in CSS from the first paint, so nothing shifts when the 3D arrives.
Checklist
- Measure cold, on a phone profile with real connection costs, and on a real phone.
- One origin: bundle libraries, self-host fonts, compress text with brotli.
- Preload the first frame's files from the HTML.
- Defer everything below the fold.
- Compress geometry; size textures to how big they appear; don't re-encode lossy files.
- Compile shaders asynchronously; reduce material variants.
- Decode images off the main thread.
- Cap resolution, step down on slow frames, pause when hidden, dispose on leave.
- A loader with real progress that skips itself on fast loads.
- Headline as HTML, canvas space reserved, reduced motion handled (accessible motion).